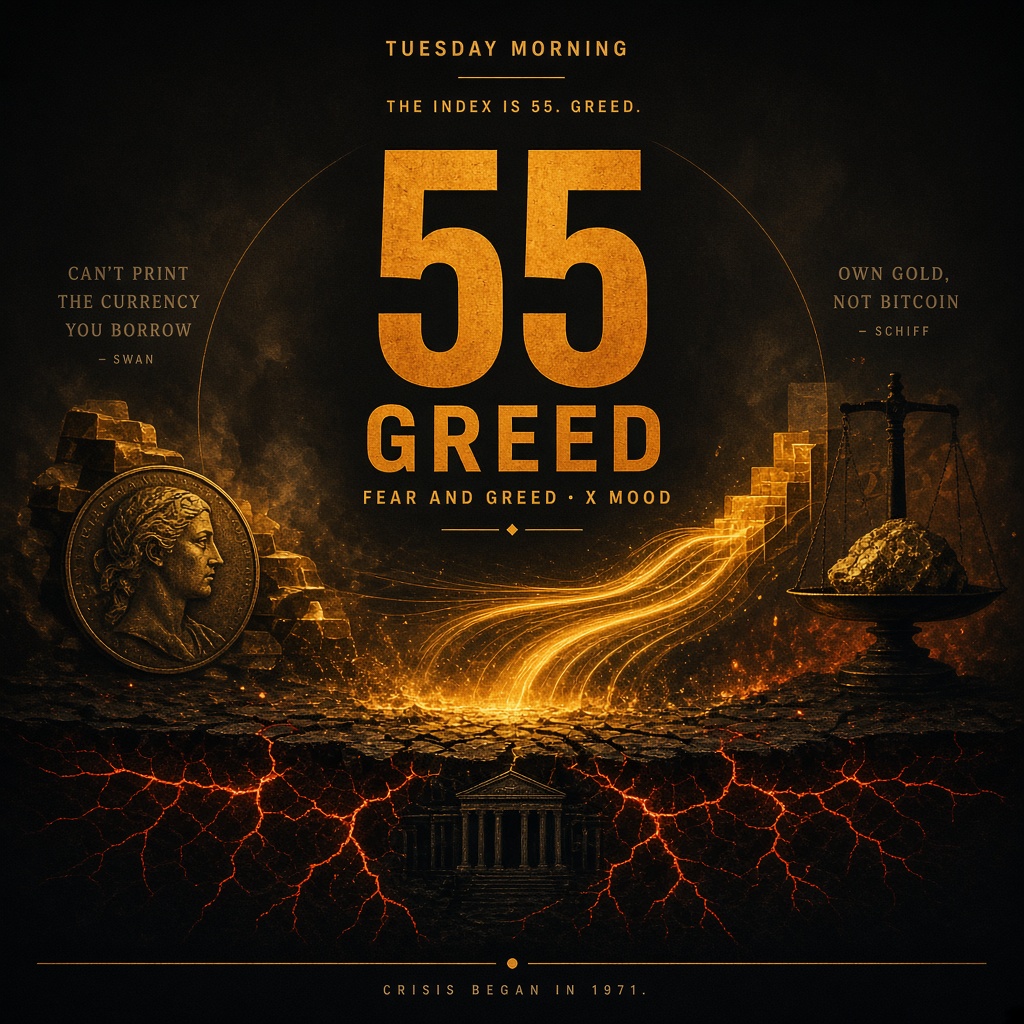
Electricity writes blocks that cannot be reprinted. Open to anyone. Every node checks the same rules. No debt on the chain.
Your hour · Québec wage · gold is the standard
In 1971 an ounce of gold cost 14 hours of work. In 2025 it cost 147.
hours of work · 2026-08-20 · Québec wage
A rising CAD wage is the illusion. The unit shrank. Count hours to one ounce of gold, and hours to one bitcoin against its 2010 dollar price.
CAD · nominal
$33.64
vs gold-wage · CAD / hour
nominal vs gold-equivalent
USD · nominal
$24.33
same hour, official FX
focus series
Gold · hours / oz
186 h
of work for 1 oz gold · 0.00537 oz / hour
nominal vs gold-equivalent
BTC · hours / coin
2,973 h
of work for 1 BTC · 0.000336 BTC / hour · 2010 dollar price still seconds of work
focus series
BTC · CAD / hour
$22.6M
2010 $20.23 → now · BTC-equivalent
nominal vs BTC-equivalent
House · gold CAD
$1.66M
1975 house as gold · vs nominal
nominal vs gold-equivalent
Hours of work to buy 1 oz gold
14 h → 147 h
10.2× · 1971–2025 · this rises
hours = gold in CAD / QC wage. 1971 is the last Bretton Woods gold-window year.
Canada house in ounces of gold
262 oz → 153 oz
fell · 1975–2025 · gold beat housing
Dallas Fed Canada HPI × 2010 CREA $339,030 / gold in CAD. Montréal official when present is the dotted line on the chart. Montréal official hours 12,787 → 19,008 (1.49×)
Hours of work to buy a Canada house
9,422 h → 22,520 h
2.39× · 1975–2025
Dallas Fed HPI × 2010 CREA/CMHC $339,030. Hours = price / QC wage. Spliced index, not an official CREA table.
Car · hours (the contrast)
1,113 h → 1,379 h
1.24× · 1975–2025 · vs house 2.39×
Also 1947: 2,655 h. Passenger cars only after ~2010 — SUVs sit in Trucks.
Trucks / SUV · hours
1,503 h → 1,749 h
1.16× · 1975–2025
StatCan Trucks = minivans, SUVs, light and heavy trucks, vans, buses. Typical new vehicle (cars+trucks) 1,210 h → 1,705 h. Light trucks 2010–2025: 1,737 h → 1,667 h.
Québec full-time year in ounces of gold
(QC hourly × 2,080) / gold in CAD · 2,080 = 40×52, not official annual earnings · gold CAD from 1957. 1970: 148.5 oz · 2025: 14.2 oz · 2026 YTD: 11.0 oz.
US median family income, 1971: $10,290 ÷ gold $41 = 251.0 oz. Same ounces at gold on 2026-10-19 ($4,176.10) = $1,048,099. 2025 closed family income is $110,500. Not Québec wages.
Nominal wage vs gold-equivalent wage · CAD per hour · 1971 oz/hour held constant · linear. Shaded = CAD/hour loss.
Gold-equivalent wageNominal wageCAD/hour loss (gold-wage − nominal)
1971 hour = 0.069773 oz gold. Same gold, later CAD price of gold = gold-equivalent wage. 2019: gold-wage $128.87/h vs nominal $25.44. 1977-base check: $67.7 vs $25.44. Only years both series exist.
Nominal wage vs BTC-equivalent wage · CAD per hour · 2010-07-18 BTC/hour held constant · log. Shaded = CAD/hour loss.
BTC-equivalent wageNominal wageCAD/hour loss (BTC-wage − nominal)
2010-07-18 hour held as a constant amount of bitcoin, priced in CAD. Rising CAD wage is the fiat illusion; the BTC hour is the dollar-power line.
Hours of work to buy 1 oz gold · 1971–now · linear (up = fiat diluting against gold)
Hours to 1 BTC vs hours to the 2010 dollar price of 1 BTC · log. Up on the orange line = more life for 1 coin. Gray line is the same C$0.089 still priced in later wages.
Hours to 1 BTCHours to the 2010 dollar priceSpread (dollar vs hard money)
House · car charts · secondary
Strip cards above stay primary. These charts are the long house / car detail — same series, not a second thesis.
Nominal house vs gold-equivalent house · CAD · 1975 oz held constant · linear. Shaded = CAD the dollar house failed to keep vs gold.
Gold-equivalent houseNominal house (Dallas Fed × 2010 CREA)CAD gap (gold-house − nominal)Montréal official Centris
1975 Canada house held as a constant gold amount, priced in later CAD. The dollar price rose; gold-equivalent rose more. Montréal official is the dotted line — not mixed into the national splice.
Canada house in oz gold · falling if gold beat housing
Hours of work to buy a Canada house · 1975–2025 · linear (up = labour losing to housing / fiat)
Hours of work · passenger car vs StatCan trucks (SUV/minivan/light+heavy) · QC wage
Official CPI is a yearly average of a changing basket, not the price of one thing you bought. The Bank of Canada aims at 2%, the midpoint of a 1–3% range, since 1991. At 2% a price doubles every 35 years. At 1% it takes about 70. Over 1971–2025 a constant 2% path is 2.91×; 1% is 1.71×. The 2025 print was +2.1%. The index is 7.86× 1971.
A $2 1971 all-items basket is $15.71. Phones, clothes, and furniture pull that down. The official food basket is $20.89. Eggs are not on this tape. Milk and steak skip 1971. Butter in 1971 is wholesale, not the shelf. The same $2 held in gold is $232.
CPI · 1971–2025
7.86×
20.9 → 164.2 · 3.89%/yr
focus series
2025 YoY · “under control”
+2.1%
five years 2020–25 +19.9%
focus series
$2 in 1971 is now
$15.71
food basket $20.89 · at 2% $5.83 · gold $232
focus series
2% vs 1% · 54 years
+70%
2.91× vs 1.71× · doubles in 35y vs 70y
focus series
1971=100 · log · CPI vs food vs gold CAD · official indexes, not a household budget
The claim is that school, housing, and health care rose because supply was held down and demand was subsidized, while machines got cheaper. Canada, 2000–2025, percent from each series’ own 2000 level. Tuition fees +109.9%. Owned accommodation +104.2%. Health care +59.3%, less than the all-items basket +72.1%. Household appliances ended −2.4%, after a deeper dip. Not a US hospital bill. Household appliances, not televisions.
Québec undergraduate sticker, school year against that calendar year’s wage and gold. 2006/07 $1,932 was 110.0 hours and 2.82 oz. 2024/25 $3,587 was 113.5 hours and 1.10 oz. The dollar sticker rose 86%. The hour barely moved. The sticker fell in ounces of gold.
Appliances · 2000–2025
−2.4%
Canada · ended down · dipped lower
focus series
Health care · 2000–2025
+59.3%
Canada · less than the basket
focus series
Owned accommodation
+104.2%
index · not a house price
focus series
Tuition fees · index
+109.9%
2.82 → 1.10 oz · Québec sticker
focus series
Canada · percent from 2000 · linear · StatCan 18-10-0005-01 · not a household budget
Québec sticker hours 110.0 → 113.5 h. Computer equipment, software and supplies is a different index (2011-04=100) and fell 40.5% from 2012 to 2025. It is not on this chart. Official indexes adjust for quality.
The base hurdle is the rate of monetary debasement — money-supply growth — not the CPI print. Closed December year-on-year from the site’s own M2 series. After risk and costs, this tape still uses gold CAD 9.20%/yr as the hold rate. Global broad money is not in the boot files, so it is not on this chart.
CA M2+ YoY · closed Dec
—
Canada · December only · not CPI
focus series
US M2 YoY · closed Dec
—
United States · December only · not CPI
focus series
After costs · gold CAD
9.20%
1971–2025 hold hurdle · not a yearly gold print
focus series
YoY % · closed Decembers · CA M2+ vs US M2 vs Canada CPI vs gold CAD hold 9.20% · linear · jurisdictions labeled
Canada M2+ YoYUnited States M2 YoYCanada CPI YoYGold CAD hold 9.20%
Method & sources
December / December only. 2026 June M2 is a stub, not a YoY. Global broad money is not on this tape. Nasdaq is not on this tape. S&P vs US M2 CAGRs are on the S&P module — price, not total return.
What $2 in 1971 became · log · CPI basket vs 2% path vs 1% path vs gold
CPI basketConstant 2%Constant 1%Gold CAD
United States, FRED CPIAUCNS, annual average from 1913. A $3 1913 basket is $97.72 at closed 2025 CPI — 3.07% of the old buying power left. January–July 2026 is a stub: $100.53. The same $3 in 2025 gold, from the 1913 mint price of $20.67, is $500. Not a Canada print.
Canada’s long series starts in 1914 (OECD all-items, not StatCan). A C$3 1914 basket is C$80.31 at closed 2024 — 3.74% left. January–March 2025 is a stub: C$81.19. Gold in CAD starts in 1957, so there is no 1914 gold path for that C$3.
US $3 in 1913 · closed 2025
$97.72
CPIAUCNS 9.88 → 321.94 · 32.57×
focus series
US dollar remaining
3.07%
lost 96.93% · 1913–2025 closed
focus series
Same $3 in gold USD
$500
mint $20.67 · 2025 closed gold
focus series
CAD C$3 in 1914 · closed 2024
C$80.31
OECD 4.75 → 127.09 · 26.77×
focus series
Canadian dollar remaining
3.74%
lost 96.26% · 1914–2024 closed
focus series
CAD gold 1914
—
gold in CAD starts 1957 · no 1914 path
focus series
What $3 became · log · US CPI 1913 + Canada OECD 1914 vs gold USD · closed years
$3 US CPIC$3 Canada OECD$3 gold USD
Method & sources
Statistics Canada table 18-10-0005-01, Canada all-items / food / owned accommodation, annual average, 2002=100. 2025 all-items 164.2, +2.1% (Daily, 2026-01-19). Bank of Canada inflation-control target: 2% midpoint of 1–3%, adopted 1991, renewed through 2026. $2 paths are 2 × (index_t / index_1971) or 2 × (1+r)^(t−1971). Gold companion is gold in CAD. United States $3 path is FRED CPIAUCNS annual average / CPI_1913 × 3; 2026 is Jan–Jul average, not December. Gold USD companion is gold (1913 mint $20.67). Canada C$3 path is FRED CANCPIALLMINMEI (OECD MEI) annual average / CPI_1914 × 3; closed 2024 (12 months); 2025 Jan–Mar is a stub. Not StatCan 2002=100. gold in CAD starts 1957 — no 1914 CAD-gold path.
Gold · the hard ruler
Measured in gold, the Canadian dollar has lost 9.2% a year since 1971.
YoY % in gold (CAD) · 1971–2025 closed
Official CPI is the yearly print they target. Here the measure is the CAD price of one ounce of gold. 1971–2025: gold CAD 9.20%/yr (C$41.41 → C$4,809.51, 116×). Québec wages 4.60%.
QC wage YoY vs hold hurdle (1971–2025 gold CAD CAGR 9.20%) · hurdle is the average, not a yearly gold print · dashed pre-tax lines are labeled scenarios
1971 $2.89/h → 2025 actual $32.75 vs gold-wage $335.57. Hold compounds at 9.20%/yr. The 30 / 40 / 50% lines are labeled scenarios, not a Canadian average tax rate.
Method & sources
The state
Government spends 43% of Canada’s economy, up from 27% in 1961.
general government expenditure / GDP · StatCan 1961–2025 · OECD OTES13 from 1981 · US OECD 1970–2024
Spending, transfers, and tax-to-GDP are the claim on the unit. Debt and M2 finance that claim when tax is not enough. The remaining gold hour is after-tax wage divided by the gold-equivalent wage.
Canada state share
44.7%
OECD 2025 · StatCan 43.1% · 1961 27.4%
focus series
Canada transfers / GDP
10.3%
cash to households · 1961 5.4% · not hospitals/schools
focus series
Canada tax-to-GDP
34.9%
OECD 2024 · 1965 25.0% · 2025 unpublished
focus series
Remaining gold hour
7.3%
after-tax $24.36 / gold-wage $335.57 · TW 25.6%
focus series
State share % GDP · Canada vs United States · OECD OTES13 not spliced to StatCan
Canada cash transfers / GDP vs OECD tax-to-GDP · health/education are not in the transfer line
Transfers to households / GDPTax-to-GDP (OECD)
Canada residual vs state · private_share = 100 − state_share (residual, not a productivity census) · public employment includes schools and hospitals
State share StatCan % GDPResidual 100 − state (not a job census)LFS public employment % (schools + hospitals in)
2025 Canada: OECD state share 44.7%, StatCan 43.1%, cash transfers 10.3%. Tax-to-GDP last print 2024 34.9%. LFS public employment 21.6% (1976 was 23.7%) — flat-to-down while spending and transfers rose. QC 2025 hour $32.75 × (1 − 0.2561 OECD TW) = $24.36 vs gold-wage $335.57 → 7.3% of the gold hour left. US OECD state share 2024 39.6%; CES government / nonfarm 2025 14.8% (includes public teachers and hospital staff).
Method & sources
Money & debt
US public debt is $40.26T. The economy under it is $32.48T.
Native units. Debt and M2 finance the state when tax is not enough.
Canada · CAD
CA M2+ SA
C$3.48T
Jun 2026 · millions native 3,478,872
CA federal net debt
C$1.39T
FY2025-03-31 · Public Accounts
CA GDP SAAR
C$3.32T
2026 Q1 · current prices
United States · USD
US M2 SA
$23.16T
Jun 2026 · billions native 23,155.2
US public debt
$40.26T
2026-10-01 · Debt to the Penny
US GDP SAAR
$32.48T
2026 Q2 · current dollars
Method & sources
FX (report only, not a tile conversion): CA M2+ US$2,448.2B at BoC 2026-06-30 1.4210 · CA net debt US$969.4B at 2025-03-31 1.4376 · CA GDP US$2,382.9B at 2026-03-31 1.3939 · US M2 C$32,913.5B at 2026-06-30 1.4210 · US debt C$55,621.9B at 2026-08-18 1.3889 · US GDP C$46,147.3B at 2026-06-30 1.4210. Latest-FX column in the report is not used here.
How the paper money is holding
These are separate readings, not one score. A blank means we do not have a number we trust. Bitcoin’s price stays at the top of the page. It is the measuring stick, not one of these rows.
France borrowingFrance pays more than Germany to borrow for 10 years. The daily reading replaces this line.
What the US owesThe debt tile above is the number. The economy under it was last measured in the spring.
How much moneyCanada and the US are in the tiles above. A world total is not a number we can fetch cleanly, so it is not here.
Currencies in free-fallWe do not have a live count of currencies collapsing. A history of old collapses is not that count.
War spendingNot a number we update here yet.
Canada leaving marketsThere is no single number for that. The debt tile is what the government owes, not a freedom score.
1929–1934
The Depression was not a gold shortage.
1933–34 · official mint vs market
The metal did not run out. U.S. gold stock rose from $4.10 billion in October 1929 to $4.45 billion in September 1931. After Britain left gold, the stock fell (to $3.99 billion). What failed was a fractional-reserve system under a legal gold-cover rule on Federal Reserve notes (40% at $20.67; excess was free gold). Commercial-bank deposits were a claim on the bank, not a direct gold window. In March 1933 an internal drain (coin versus deposits) and an external drain (fear of devaluation) exhausted free gold. Convertibility stopped.
The policy response was not to find more metal. It was to force private gold into government hands at $20.67, then raise the official price of the same ounce by 69% to $35. The gold stock went from $4,033 million (January 1934) to $7,438 million (February) — $2.8 billion of that was the repricing itself, loosening the cover constraint. This was a deliberate devaluation of the paper claim — the founding act of the modern fiat dollar.
Official mint
$20.67
to 1933 · 40% cover at this price
focus series
Market 1933
$24.44
MeasuringWorth NY market
focus series
Official 1934
$35
Jan 31 · dollar 59.06% of 1879 par
focus series
Gold stock
$4.10B → $4.45B
Oct 1929 → Sep 1931 inflow
focus series
Revaluation
$4.033B → $7.438B
Jan → Feb 1934 · $2.81B is repricing profit
focus series
Money stock
−1/3
Friedman/Schwartz 1929–33
focus series
Gold USD · MeasuringWorth · 1925–1940 · linear · markers 1929 / 1933 EO 6102 / 1934 $35
Method & sources
Official mint $20.67 (to 1933) and $35 (Jan 31 1934) are labeled separately from the market series (1933 $24.44, 1934 $34.94). Gold stock $4.10B → $4.45B is two cited prints, not a plotted series; after Britain left gold the stock fell to $3.99B. Gold stock $4,033M (Jan 1934) → $7,438M (Feb 1934): $2,812M is the revaluation profit at $35, the rest February inflows (Federal Reserve Annual Report 1934). Sources: Federal Reserve History, Roosevelt's Gold Program; FRASER/Meltzer; EO 6102 (presidency.ucsb.edu); NBER w26085; FRED M1437BUSM144NNBR note; Friedman & Schwartz, A Monetary History (1963); gold / MeasuringWorth. Fisher, Debt-Deflation (Econometrica 1933); Keynes, General Theory (1936); Schumpeter, Capitalism, Socialism and Democracy (1942); Hayek, Prices and Production (1931) — named mechanisms, not extra gold prints. U.S. unemployment, BLS LFU21000100, annual, persons 14 and over: 3.2% (1929), 24.9% (1933), 14.3% (1937), 19.0% (1938), 17.2% (1939). Not the CPS monthly series (1940+, age 16+). Not plotted.
Three economists who lived the 1930s named different parts of the same machine. They can all be right at the end of a long credit cycle: liquidation raises the real burden of debt, demand collapses when everyone cuts spending together, and the crash also clears weak structures. The gold prints above stay the cover drain and the $20.67 → $35 rewrite.
Fisher · debt deflation
Debts stay
Nominal debts, falling prices · real burden rises
focus series
Keynes · demand
Spending is income
Everyone cuts at once · incomes fall
focus series
Schumpeter · destruction
Clears the weak
Liquidation so new industry can appear
focus series
Hayek, Prices and Production (1931), named the boom before that drain. Credit was expanded. The market rate sat below the rate genuine saving would have set. Longer projects were started on that signal. When the expansion stopped, those projects no longer cleared.
Hayek · the boom
Cheap credit
Market rate below genuine saving · longer projects started
focus series
Hayek · the bust
The correction
Projects that cleared only at the cheap rate
focus series
U.S. unemployment
17.2%
1939 · from 3.2% in 1929 · peak 24.9% · BLS, age 14+
focus series
Gold’s physical properties explain why it was chosen as money. Its market value, however, rested heavily on the monetary premium that came with that role. Once the state could compel surrender of the physical metal and rewrite the terms of the claim, the bearer character of gold proved limited. The episode remains the clearest demonstration that a monetary asset held through intermediaries or subject to legal seizure is not fully sovereign.
Stocks · S&P 500 price, not total return
The S&P 500 bought 4.77 oz of gold in 2000. In 2025, 1.99.
The headline is the price, not dividends. 1871–2025 is Shiller’s December average of daily closes, not December 31. 2026-08-21 is a live Yahoo print. In gold ounces, 2000–2025 is 4.77 oz → 1.99 oz.
S&P 500 · live
7,673.04
1.66 oz gold · 2026-08-21 Yahoo
focus series
S&P in gold
1.66 oz
1971 2.42 oz · 2025 1.99 oz · live 1.66 oz
focus series
1971 · Shiller December
99.17
2.42 oz gold · last gold-window year
focus series
1980 gold spike
0.22 oz
S&P $133.50 · peak 1999 5.12 oz
focus series
2000–2025 · gold oz
4.77 → 1.99 oz
−58% in gold · +415% USD · 2011 0.79 oz
focus series
S&P 500 USD · log · 1971+ · price, not TR · Shiller Dec avg, 2026 Yahoo live
S&P 500 in ounces of gold · linear
US S&P · % since 1964
+8,062%
Shiller Dec $83.96 → $6,853 · live +9,039%
focus series
QC wage · % since 1964
+1,707%
C$1.81 → C$32.75 · not US BLS
focus series
Gold CAD · % since 1964
+12,638%
C$37.76 → C$4,809.51
focus series
Percent since 1964 · US S&P vs QC wage vs gold CAD · linear · 2026 = S&P live only
US S&P 500 (Shiller / Yahoo)Québec hourly (not US BLS)Gold CAD
Method & sources
Percent since 1964. US S&P is Shiller December (1964 = $83.96). Québec hourly is a different geography than US production wages (BLS CES0500000008 / AHETPI — not on this tape). Gold CAD is the site unit. 2026 S&P is Yahoo live, not a December average.
Saifedean · money
Money is what people accept only so they can trade it for what they want.
Ideas from Saifedean Ammous on money, in plain words. Each line says where it comes from.
Why money existsBarter works in a small group with few goods. Once there are many people and many goods, wants do not line up. People then take something they do not want, only so they can trade it for what they do want. That is money. The one that wins is the easiest to keep over time, split into small pieces, and carry across a distance.His free lesson “Money”, with Menger
States did not invent itMoney came out of trade, not out of a law. States did not make gold into money. They put gold in their coins so people would take the coins.His free lesson “Money”, quoting Menger
HardnessStock is everything already above ground. Flow is what is made this year. Gold won because a year's new gold is tiny next to the stock: it does not rust, and it is not used up. The hardest money wins. Bitcoin drops the metal and keeps that economic part.His free lesson “Money as Solution for Coincidence of Wants”
Fixed supply is not a defectA critic says a fixed supply makes bitcoin too volatile to be money, because gold mines can answer a rise in demand. His reply: gold won because new metal is tiny next to the stock, not because mines rescued the price. More demand should raise what the existing coins buy. It should not call more coins into being. A wild price while people are still building balances is the transition, not the destination. Holding it to spend later is already using it as money.His public reply to Lawrence White, 13 Oct 2026
How far aheadMoney lets people specialise, and put one price on each good instead of a price for every pair. The better it holds its value, the less uncertain the future is, and the further ahead people plan. He calls that the most important idea in the subject.His free lesson “Money”, and his course page for The Bitcoin Standard
What easy money buys a stateA state that can make money can pay for war and for running people's lives, and it can do that at the holder's expense. Sound money is the limit on that.His course page for The Bitcoin Standard, lecture 7
Debt is how it is minedNew money appears when a bank backed by the central bank makes a loan, not when a press prints a note. Getting someone into debt brings new money into being. People who hold cash then lose purchasing power as others borrow. People in debt gain some of that. He calls it a subsidy from the saver to the debtor.The Fiat Standard, chapters 4 and 5
Bitcoin · cycles
Every finished cycle fell 75 to 81% from its peak, in today's dollars.
2025 dollars · gold · a dollar a day
First market price was 8.6 cents in July 2010. Halvings on the chart are supply dates, not a forecast.
Below the peak
−36%
peak Oct 2025 · low so far −54%
focus
In gold
19.7 oz
per coin
focus
A dollar a day
2,775×
from $1 · from $100,000 is under
focus
Price in today's dollars · log · halvings marked
2025 US dollars · US CPI · month-end, then daily
Ounces of gold per coin · yearly gold average until Aug 2025
US$1 every day · from first day at each price
From $1
—
$1/day
DCA chart
From $100
—
$1/day
DCA chart
From $1,000
—
$1/day
DCA chart
From $10,000
—
$1/day
DCA chart
From $100,000
—
$1/day
DCA chart
Stack value (USD) · log · $1/day from each threshold
Method & sources
Paper bitcoin
A claim on bitcoin is not bitcoin.
ETF · treasury equity · not the coin
IBIT is a fund that holds bitcoin. The other tickers are companies that say they hold it. Their price also moves on leverage, new shares, and the stock-market clock. None of that mints a coin.
BTCUSD
—
spot · yardstick
IBIT
—
iShares Bitcoin Trust · ETF
MSTR
—
Strategy Inc · treasury
ASST
—
Strive, Inc. · treasury
ALCPB
—
Capital B · Euronext
BLGVF
—
Belgravia Hartford · OTC
NAKA
—
Nakamoto Inc. · treasury
Day percent is last two Yahoo daily closes (session hours). Thin names (OTC, Euronext) gap. The coin does not care. Not a holdings census.
Market tape · cap / volume / chain
Market
Market cap
$1.65T
$1,650,967,139,820
focus series
24h volume
$26.23B
USD spot · CoinGecko
focus series
BTC dominance
60.2%
Share of total crypto mcap
focus series
Fear & Greed
72
Greed
focus series
Bitcoin blockchain
Block height
972,137
4,336 tx · 1:43 PM ET
Hashrate
1021.6 EH/s
Difficulty 140.58T
Mempool
45,838
25.5 vMB unconfirmed
Recommended fee
1 sat/vB
next 5 · 30m 5 · 1h 4 · eco 2
Groceries · houses · metal spots
Québec groceries + Montréal house · hours of work
Montréal median SFH
C$622,500
19,008 h · 2025 / $32.75
1 kg butter · Québec
C$12.45
0.37 h · 22 min · retail 2026 YTD
1 L milk · Québec
C$2.93
0.087 h · 5 min · retail 2026 YTD
1 kg sirloin · Québec
C$29.90
0.89 h · 53 min · retail 2026 YTD
1 pizza 390 g · Québec
C$4.65
0.14 h · 8 min · retail 2026 YTD
Sainte-Agathe agglomeration SFH
C$495,000
14,715 h · 2026 LTM to Q2 · not a closed year
Ville Q2 $563,500 (55 sales) · not this series
Versus gold & silver · USD spot
Gold · XAU
$4,520.20
per troy ounce
Silver · XAG
$68.31
per troy ounce
BTC / gold
16.12 oz
ounces of gold 1 BTC buys
BTC / silver
1,066.74 oz
ounces of silver 1 BTC buys
Perps · liquidations · headlines
Longs / shorts · measured perps
as of 2:23 PM ET · not a global all-venues total
Open interest
$24.59B
major BTC perps we actually pulled
Binance global accounts
49.79%
long · L/S 0.9916
24h liquidations
$703M
longs $38.8M · shorts $664.4M
7-day median rule
SHORTS OBLITERATED
shorts 83.9× median and ≥ $100M
Method & sources
Headline OI is a major-venue lower bound (Binance/Bybit/OKX/Bitget/HTX/Gate linear + OKX/Bybit/BitMEX inverse + CoinGecko Hyperliquid). 24h liq and hourly bars are AskSurf BTC aggregates. A side is obliterated if 24h ≥ 3× the 7-day median of that side and ≥ $100M.
What’s driving the market
CoinDesk · Aug 20, 2026
FUD · three cycles · two collapses
The fear changes every few years: energy, then quantum, then AI. The shops failed on their own.
Each wave comes with a claim, a few loud dates, and an outcome. Score them. One faded. One is a real engineering problem with no deadline yet. One is still running. Under that, two shops that lost customer coins and said otherwise while people could still deposit.
1 · Energy
2018–2022
faded the climate case lost its numbers
2 · Quantum
2019 → now
live real risk · fixes are still drafts
3 · AI
2024 → now
ongoing the money came back; the miners did not
1 · Bitcoin will cook the planet
Oct 2018 → 2022 · peak May 2021faded
The claimMining burns so much fossil power that bitcoin alone could push the world past 2 °C of warming. Companies and lawmakers should refuse it or ban the way it is made.
Oct 29, 2018A paper in Nature Climate Change says bitcoin “could alone produce enough CO2 emissions to push warming above 2 °C within less than three decades”, if it spreads like other technologies.Mora et al., Nature Climate Change
May 12, 2021Tesla stops taking bitcoin for cars over the “rapidly increasing use of fossil fuels for Bitcoin mining and transactions, especially coal”. On Jun 13, Musk says it will come back at “~50%” clean energy with a positive trend.CNBC, May 12, 2021 · CNBC, Jun 13, 2021
Mar 14, 2022The European Parliament's economics committee votes down a MiCA amendment that would have phased out proof-of-work in the EU.Politico Europe
2024–2026The same man now runs his AI on natural-gas turbines. Colossus in Memphis was permitted for 15 turbines, about 247 megawatts, after flyovers counted about 35. At the Mississippi site, state emails counted 46 turbines in May 2026, 60 in June, and 69 by July. Wired reported 19 added in two months, more than 500 megawatts.Global Energy Monitor · Scientific American, Sept 2026 · Wired, May 12, 2026
What happenedThe same journal ran a reply in Aug 2019 titled “Implausible projections overestimate near-term Bitcoin CO2 emissions.” By Cambridge's 2025 miner survey, 52.4% of mining power was sustainable (42.6% renewables, 9.8% nuclear), up from 37.6% in 2022. That is past Musk's ~50% bar. The honest part: it is a survey of miners covering about half the hashrate, not a meter on every machine, and natural gas is still the biggest single source at 38.2%.Masanet et al., Nature Climate Change, Aug 28, 2019 · Cambridge CCAF, Apr 28, 2025
2 · A quantum computer will steal the coins
Oct 2019 → now · sharpest since Mar 2026live
The claimA big enough quantum computer can work out a private key from a public key. Coins whose public keys are already on the chain, old addresses and reused ones included, could be taken.
Oct 23, 2019Google's 53-qubit Sycamore claims “quantum supremacy” on a sampling task. Impressive physics, and no code was broken.Arute et al., Nature
Dec 9, 2024Google's 105-qubit Willow shows error correction getting better as it scales. Three days later Google says Willow cannot break modern cryptography.Google, Dec 9, 2024 · The Verge, Dec 12, 2024
Mar 31, 2026Google estimates that the curve behind bitcoin's signatures could be broken with fewer than 500,000 physical qubits in a few minutes. That is about 20 times fewer than earlier estimates. Google has set its own move to post-quantum cryptography for 2029.Google Research, Mar 31, 2026
Feb–Apr 2026Two drafts land in the BIPs repository. BIP-360 (Feb 11) adds an output type without the exposed key path. BIP-361 (Apr 14) would phase out today's signatures, and coins that are never moved would end up unspendable. In July the fight turns to Satoshi's estimated 1.1 million coins: freeze them, or let whoever breaks them take them.BIP-360 · BIP-361 · Bitcoin Magazine, Apr 15, 2026 · CoinDesk, Jul 4, 2026
Where it standsNo machine today breaks a bitcoin key, and Google itself warns that loose estimates can be FUD on their own. But the bar keeps dropping, and bitcoin's fixes are drafts with no activation date. The hardest part is not the cryptography. It is who decides that coins which do not move stop being money. That is 1933 again, written into code. Practical step now: do not reuse addresses.Google Research · Bitcoin Magazine
3 · AI takes the miners, the power and the money
Jun 2024 → now · peak Q2 2026ongoing
The claimAI pays more for the same power, so miners rent their sites to AI and the hashrate that guards the chain shrinks. Speculative money that bought bitcoin buys AI instead. And software agents will pay each other in dollar stablecoins, not bitcoin.
Jun 3, 2024Bitcoin miner Core Scientific signs 12-year contracts to host about 200 MW of CoreWeave's AI computing. The miner-to-AI pivot starts here.Core Scientific
Apr–May 2025The IEA projects data-centre power use more than doubling, from 415 TWh in 2024 to about 945 TWh by 2030, with AI the main driver. In May, Coinbase launches x402 so agents can pay over the web, starting with the USDC stablecoin.IEA, Energy and AI · Coinbase, x402
Jun 5, 2026Bitcoin is below $60,000, more than 50% off its peak, after $3.45B of spot-ETF outflows in 11 sessions. Saylor: “This is a capital rotation, not a bitcoin impairment.” K33's Vetle Lunde: much of the market sees “the opportunity cost of holding BTC as too high while anything AI-related soars.”CoinDesk, Jun 5, 2026 · CoinDesk, Aug 4, 2026
Where it standsThe money part reversed. In Q3 2026 bitcoin rose 42.7% to $83,554 and spot ETFs took in $6.36B net. The miner part did not reverse. The chain is still secure at today's hashrate, but its security budget leans on a subsidy that halves again around 2028, with fees under 1%. Agents are not settled either: Lightning Labs shipped open-source tools for agents to pay in bitcoin in Feb 2026.CoinDesk, Oct 8, 2026 · Lightning Labs, Feb 11, 2026
The shop, not the coin · Mt. Gox
Feb 7 → Feb 28, 2014
What they saidA technical pause. Customers could still trade.
Feb 7, 2014Mt. Gox pauses all bitcoin withdrawals “for the extremely short notice,” blames traffic, and says an update will come Monday. Customers can still use the trading platform.TechCrunch, Feb 6, 2014
Feb 10, 2014The pause becomes indefinite. The exchange says it found “unusual activity” and blames a bug in bitcoin software that “affects all transactions,” not only Mt. Gox.Reuters, Feb 10, 2014
Feb 25, 2014The site goes dark. A leaked crisis draft, dated that day, says about 744,408 bitcoin had already been lost and the loss had gone unreported for years. Trading had continued since Feb 7. Karpeles emails Reuters that the business is at “a turning point” and he “can't tell much more for now.”CoinDesk, Feb 25, 2014 · Reuters, Feb 25, 2014
Feb 28, 2014Bankruptcy in Tokyo. The company says 850,000 bitcoin are gone: 750,000 customer coins and 100,000 of its own. In a later U.S. filing, Karpeles says the Feb 7 halt was already because of “the theft or disappearance of hundreds of thousands of bitcoins.” If that declaration holds, the shop kept trading for 18 days after it knew.The Verge, Feb 28, 2014 · InfoWorld, on the U.S. filing
What happenedOn March 7 they said they found about 200,000 bitcoin in an old wallet they had thought was empty. A lawyer tracking those coins in a Chicago case said the Dallas court was not told. Customers waited about ten years for a partial return. The coins that were stolen were stolen from a shop that held other people's keys. Bitcoin kept producing blocks.Reuters, Mar 21, 2014
The shop, not the coin · FTX
Nov 7 → Nov 11, 2022
What they saidAssets are fine. Withdrawals will continue. The U.S. shop is untouched.
Nov 7, 2022Sam Bankman-Fried posts that a competitor is spreading false rumors. “FTX is fine. Assets are fine.” He says the exchange has enough to cover all client holdings, does not invest client assets, and will keep processing withdrawals.Business Insider, Nov 9, 2022
Nov 8, 2022Withdrawals stop. He deletes the “assets are fine” post the day he announces a Binance rescue that Binance then walks away from. Traders had pulled about $6 billion in 72 hours.Crypto Daily, Nov 8, 2022 · Reuters, Nov 12, 2022
Nov 10, 2022He apologizes and writes “FTX US USERS ARE FINE!” and that the U.S. exchange “was not financially impacted by this shitshow.”The Block, Nov 11, 2022
Nov 11, 2022Chapter 11. He resigns. FTX, FTX.US, and Alameda file together, more than 100 companies. Sources told Reuters he had moved about $10 billion of customer funds to Alameda, and at least $1 billion was gone.The Verge, Nov 11, 2022 · Reuters, Nov 12, 2022
What happenedJohn Ray, who took over, told the court in March 2024 that FTX.com had 105 bitcoin left against customer entitlements of nearly 100,000. The plan prices a bitcoin claim at $16,871.63, the petition-date price, and pays cash, not coins. He was sentenced to 25 years. Same split as Mt. Gox: the shop spent customer coins. The chain did not.CoinDesk, Mar 20, 2024 · Protos, on the $16,871.63 table
Method & sources
A cycle is a claim that bitcoin is about to fail for one outside reason, loud enough to move companies, lawmakers or flows. The two collapses are different: a shop that already knew the coins were gone and kept taking deposits. Dates are when the event was published. Status: faded means the claim's numbers did not hold; ongoing means part of it reversed and part did not; live means the risk is real and the fix is not done. No price forecasts. Static text, checked Oct 9, 2026. Every claim links to its source above.